Home >> Nuclear, stability: the N-Z curve
the N-Z curve |
The N-Z curve
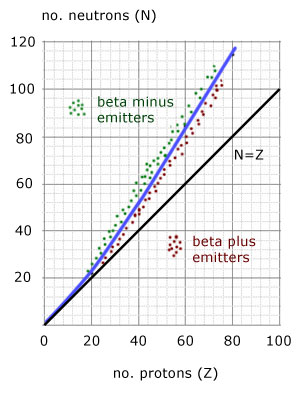
The N-Z curve is a plot of the number of neutrons(N) against the number of protons(Z).
lines:
i) the 'stability' line - a gentle curve starting from the origin and of increasing gradient
ii) the line of N = Z - a straight line of gradient '1' through the origin
regions
i) beta minus(electron) particle emitters
ii)beta plus(positron) particle emitters
iii) alpha particle emitters top of curve(not shown)
description:
For proton numbers(Z) up to 20, N=Z is a straight line.
For all nuclei with Z>20 , stable nuclei have more neutrons than protons, the line curves upwards.
Unstable nuclei above the stability curve are called neutron-rich.
Unstable nuclei below the stability curve are called neutron-poor.
The Decay Process
Unstable neutron-rich nuclei can become more stable by losing neutrons. They do this by 'beta decay'.
The effect of this for a single nucleus is to raise its the proton number (Z) by 1 and decrease its neutron number(N) by 1, bringing the N-Z plot of the nucleus closer to the stability curve.
The movement of the point is right one unit and down one unit.
beta decay: Z + 1 N - 1
![]()
Unstable neutron-poor nuclei can become more stable by gaining neutrons. They do this by 'positron decay'.
The effect of this for a single nucleus is to lower its proton number (Z) by 1 and increase its neutron number(N) by 1 , bringing N-Z plot of the nucleus closer to the stability curve.
The movement of the point is left one unit and up one unit.
positron decay: Z - 1 N + 1
![]()
Alpha decay has very little effect on the position of a nucleus relative to the stability curve. This is is because the loss of an alpha particle(2 protons + 2 neutrons)does not upset the N-Z ratio too much.
The point representing a nucleus has Z - 2 and N - 2 . Only large nuclei participate in alpha decay. So the effect is only confined to the very top section of the curve.
alpha decay: Z - 2 N - 2
![]()
Decay Chains
A decay chain (or radioactive series) charts the different types of radioactive decay a nucleus undergoes until a stable isotope is reached.
There are only 3 naturally occuring decay chains called the:
actinium series, thorium series, uranium series,
plus one other involving a trans-uranium element, the neptunium series.
A decay chain is accurately described using a graph of nucleon number(A) against proton number(Z).
The graph illustrates the complete Thorium-232 decay chain.
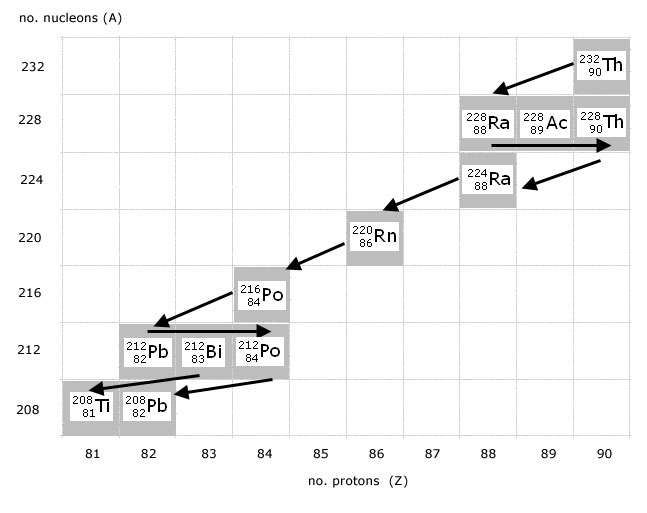
click on image to magnify (in pop-out page)
Important observations are:
alpha decay ...........2 units to the left, 4 units down
beta- decay ...........1 unit to the right
Bismuth ...............2 possible decay outcomes
Equations describing the Thorium Series:
![]()
![]()
![]()
![]()
. . . etc.
As an exercise, it is left to the reader to complete the series using the decay chain graph(above).
this week's promoted video
[ About ] [ FAQ ] [ Links ] [ Terms & Conditions ] [ Privacy ] [ Site Map ] [ Contact ]